GraVent Explosion Channel
This section introduces the experimental setup. Please note that geometrical configurations as well as transverse concentration gradient profiles are provided here.
General
The GraVent explosion channel operated at the Institute of Thermodynamics, TUM, is similar to other typical explosion test facilities with high aspect ratio (length-to-diameter/width ratio). The basic idea of reaching fast combustion regimes at laboratory scale is to provide a high degree of confinement and congestion. These are realized as an entirely closed channel equipped with evenly spaced obstacles. This type of experiment was extended by mechanisms for the generation of transverse concentration gradients and for water mist injection.
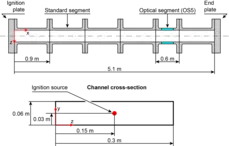
The channel is composed of up to six segments. Solid plates, referred to as ignition and end plate, close the channel at both ends. The following coordinate system is used: axial direction x, vertical direction y and lateral direction z as marked in Fig. E.1. Standard segments with a length of 0.9 m and one optical segment (OS) with a length of 0.6 m are available. The optical segment can be placed at arbitrary positions along the channel, denoted OS1 (optical segment at position 1, x = 0 m to x = 0.6 m), OS2 etc.
The explosion channel cross-section is 0.3 m wide and 0.06 m high. Located below this channel is an additional channel for investigating transverse venting. The explosion and venting channels are separated by solid plates. Only experiments without venting are provided in the DDT database, thus the separation plates are permanently installed.
The mixture is ignited using a low energy spark plug centered at the ignition plate. The flame travels through the channel towards the end plate. Measurement systems are triggered off the ignition signal.
Geometrical Configurations
Evenly spaced notches in the top and separation plates 0.01 m apart allow the installation of obstacles. The channel either remains entirely unobstructed (notches are covered with H2 injection manifolds at the top and with flat inlays at the bottom) or flat plate obstacles with a blockage ratio (BR) of 30 % or 60 % are used. These obstacles are not usually installed throughout the entire channel but only in a section between the ignition plate (e.g first obstacle at x = 0.25 m) and a predetermined distance from the end plate (e.g last obstacle at x = 2.05 m). The rest of the channel remains unobstructed. The specific location of the obstructed section is given in the tables below and also in each dataset. Both horizontal and vertical obstacles are tested. Obstacle thickness is 0.012 m.
The following notation is used to identify geometrical configurations:
BRxx(h/v)Syyy(L)(H2O)
xx is the value of the obstacle blockage ratio (BR) in %. Blockage ratio is defined as the ratio of obstructed and full channel cross section (BR = 2h / H in case of horizontal obstacles, cp. Fig. E.2). (v/h) identifies horizontal (h) or vertical (v) obstacles. yyy is the obstacle spacing (S) in mm. (L) denotes a special configuration with a long obstacle section. In addition, the extension H2O identifies experiments with water mist injection.
In the case of configurations with horizontal obstacles, the obstacles are always installed both at the top and bottom of the channel, cp. Fig. E. 2. The upper obstacles have special drill holes and notches that are required for the generation of concentration gradients, cp. section below. Figure E.3 shows the three types of horizontal channel top installations, BR60 (a), BR30 (b) and an injection manifold (c).
Vertical obstacles were specially designed to investigate the influence of relative obstacle and concentration gradient orientation. Both 30 % and 60 % blockage ratios are available, see Fig. E.4. Each of the obstacles is made up of four vertical parts. This way, the opening width between the solid parts equals the vertical opening height of the respective horizontal obstacles. Note that the upper and lower 6 mm of the obstacle disappear in the top and separation plate notches, the upper and lower channel walls are thus smooth at the opening of the obstacle.
The experiments currently provided in the database comprise the following configurations:
| Configuration | BR | S | obst. orient. | obst. sec. |
|---|---|---|---|---|
| [%] | [mm] | [mm] | ||
| BR00 | 0 | n/a | n/a | n/a |
| BR30hS100 | 30 | 100 | horizontal | 250-2050 |
| BR30hS300 | 30 | 300 | horizontal | 250-2050 |
| BR30vS100 | 30 | 100 | vertical | 250-2050 |
| BR30vS300 | 30 | 300 | vertical | 250-2050 |
| BR30hS300L | 30 | 300 | horizontal | 250-4950 |
| BR60hS100 | 60 | 100 | horizontal | 250-2050 |
| BR60hS300 | 60 | 300 | horizontal | 250-2050 |
| BR60vS100 | 60 | 100 | vertical | 250-2050 |
| BR60vS300 | 60 | 300 | vertical | 250-2050 |
| Configuration | BR | S | obst. orient. | obst. sec. |
|---|---|---|---|---|
| [%] | [mm] | [mm] | ||
| BR30hS300H2O | 30 | 300 | horizontal | 150-4050 |
H2-Air Mixture and Transverse Concentration Gradient Generation
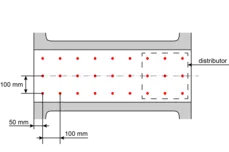
Figure E.5. illustrates the generation of concentration gradients. The last obstacle of BR60S300 (x = 2.05 m) and the first injection manifold of the unobstructed channel section (x = 2.15 m) are depicted. In a first step, the channel is filled with ambient air. Using a vacuum pump, the explosion volume is partially evacuated. Initial pressure prior to H2 injection depends on the requested H2 concentration and is calculated by the method of partial pressures. Then, H2 at a pressure of 8 bar from a gas cylinder is injected through a regular pattern of injection ports in the facility's top plate (1). This pattern is shown in Fig. E.6. for a standard segment. Each row of ports comprises three ports across the channel width. Axial positions of rows coincide with notch positions in the top plate. Distributors connect 9 injection ports each to the H2 supply system. In each distributor a 0.9 mm choked aperture controls the flow rate. The H2 flow is deflected inside the channel, forming a compact horizontal H2 layer along the channel top (2). At obstacle positions in the obstructed channel section, H2 deflection is achieved by slots in the upper obstacles. Positions between obstacles as well as top plate notches in the unobstructed section are equipped with manifolds protruding into the channel at the upper wall (cp. Fig. E.3. (c)). These manifolds do not significantly influence the DDT process. Vertical concentration gradients form due to diffusion (3). The orientation of resulting gradients (4) is thus normal to the main direction of explosion front propagation.
Gradients of defined slope can be generated by controlling the diffusion time td between H2 injection and ignition. A diffusion time of 60 s yields a homogeneous mixture, whereas a diffusion time of 3 s results in a steep concentration gradient. Further diffusion times of 10 s, 7.5 s and 5 s have been investigated.
The method for concentration gradient generation has been characterized experimentally and numerically in previous work by Vollmer et al. [1] and Ettner et al. [2], respectively. Figure E.7. gives a first impression of concentration gradients.
Profiles computed in the latter work were transformed into polynomials that describe the concentration profiles:
The general notation is as follows:
XH2(y) = p1×y4 + p2×y3 + p3×y2 + p4×y +p5
where y is the vertical position in the channel in [m] according to the coordinate system introduced in Fig. E.1. and pi are polynomial coefficients given in the following table:
| XH2 | td | p1 | p2 | p3 | p4 | p5 |
|---|---|---|---|---|---|---|
| [-] | [s] | [1/m4] | [1/m3] | [1/m2] | [1/m] | [-] |
| 0.1 | 3 | -2.73E+04 | 1585 | 49.48 | 0.241 | 0.01765 |
| 5 | -6186 | -426.5 | 81.55 | -0.09072 | 0.0425 | |
| 7.5 | -964.3 | -594.2 | 60.19 | -0.1218 | 0.0645 | |
| 10 | -172.9 | -407.3 | 37.85 | -0.08276 | 0.07806 | |
| 0.2 | 3 | -4.18E+04 | 1769 | 133.1 | 0.1339 | 0.04706 |
| 5 | -8604 | -1176 | 165.9 | -0.2946 | 0.09362 | |
| 7.5 | -1315 | -1166 | 114.1 | -0.2416 | 0.134 | |
| 10 | -246.5 | -762.9 | 70.35 | -0.1542 | 0.16 | |
| 0.3 | 3 | -3.66E+04 | 95.76 | 247.8 | -0.1624 | 0.0949 |
| 5 | -7646 | -1985 | 232 | -0.4398 | 0.1595 | |
| 7.5 | -1318 | -1577 | 151 | -0.3158 | 0.2143 | |
| 10 | -306.5 | -1002 | 92.3 | -0.2002 | 0.2476 | |
| 0.4 | 3 | -1.88E+04 | -2651 | 370.4 | -0.5813 | 0.163 |
| 5 | -4417 | -2732 | 276.6 | -0.5312 | 0.241 | |
| 7.5 | -1006 | -1828 | 171.4 | -0.3543 | 0.3041 | |
| 10 | -315.5 | -1127 | 103.6 | -0.2223 | 0.3419 |
Between the given average H2 concentrations, values can be interpolated for each diffusion time with a square fit.
[1] K. G. Vollmer, F. Ettner, and T. Sattelmayer. Deflagration-to-Detonation Transition in Hydrogen/Air Mixtures with a Concentration Gradient. Combustion Science and Technology, 184:1903–1915, 2012.
[2] F. A. Ettner. Effiziente numerische Simulation des Deflagrations–Detonations–Übergangs. Ph.D. thesis, Lehrstuhl für Thermodynamik, Technische Universität München, 2013.
Mechanism for Water Mist Injection
The GraVent facility was equipped with a water mist injection system for one specific measurement campaign. The goal was to investigate the influence of water mist on flame acceleration, DDT and detonation propagation. This is of particular interest for nuclear reactor safety since water sprinklers are part of the containment safety concept for severe accidents in several types of reactors. Results from this study are also incorporated in the DDT database. Only pressure traces could be obtained since the photodiodes did not acquire sufficient flame radiation due to the water mist.
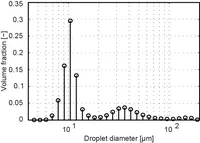
For the injection of water mist, the venting channel of the setup is equipped with 14 ultrasonic atomizers. An air flow circulating in a closed loop, driven by a diaphragm pump, transports the water mist generated in the venting channel into the explosion channel. Over a time of 60 s, water mist accumulates in the explosion volume so that a water loading ratio of 0.11 kg/m3 can be established. The water droplet size spectrum was analyzed using a Malvern Particle Sizer, see Fig. E.8. The Sauter mean diameter (SMD) is 13μm. After water injection, the H2-air mixture is prepared as described above. During each experiment the water loading ratio shortly before ignition is determined by measuring extinction. For more details on the injection method, please refer to [3].
Note that the value of the diffusion time after H2 injection of 10 s does not result in a concentration gradient in these experiments due to a different H2 injection strategy.
If you are interested in simulating one of the very lean experiments from the H2O measurement campaign, please contact us in advance. It will be necessary to consider more details of the explosion channel geometry when equipped with the water mist injection system.
[3] L.R. Boeck, A. Kink, D. Oezdin, J. Hasslberger, T. Sattelmayer, Influence of Water Mist on Flame Acceleration, DDT and Detonation in H2-Air Mixtures, International Journal of Hydrogen Energy, 40:21, pp. 6995-7004, 2015


